Cell Division Comics
Grade 9, 30-60min
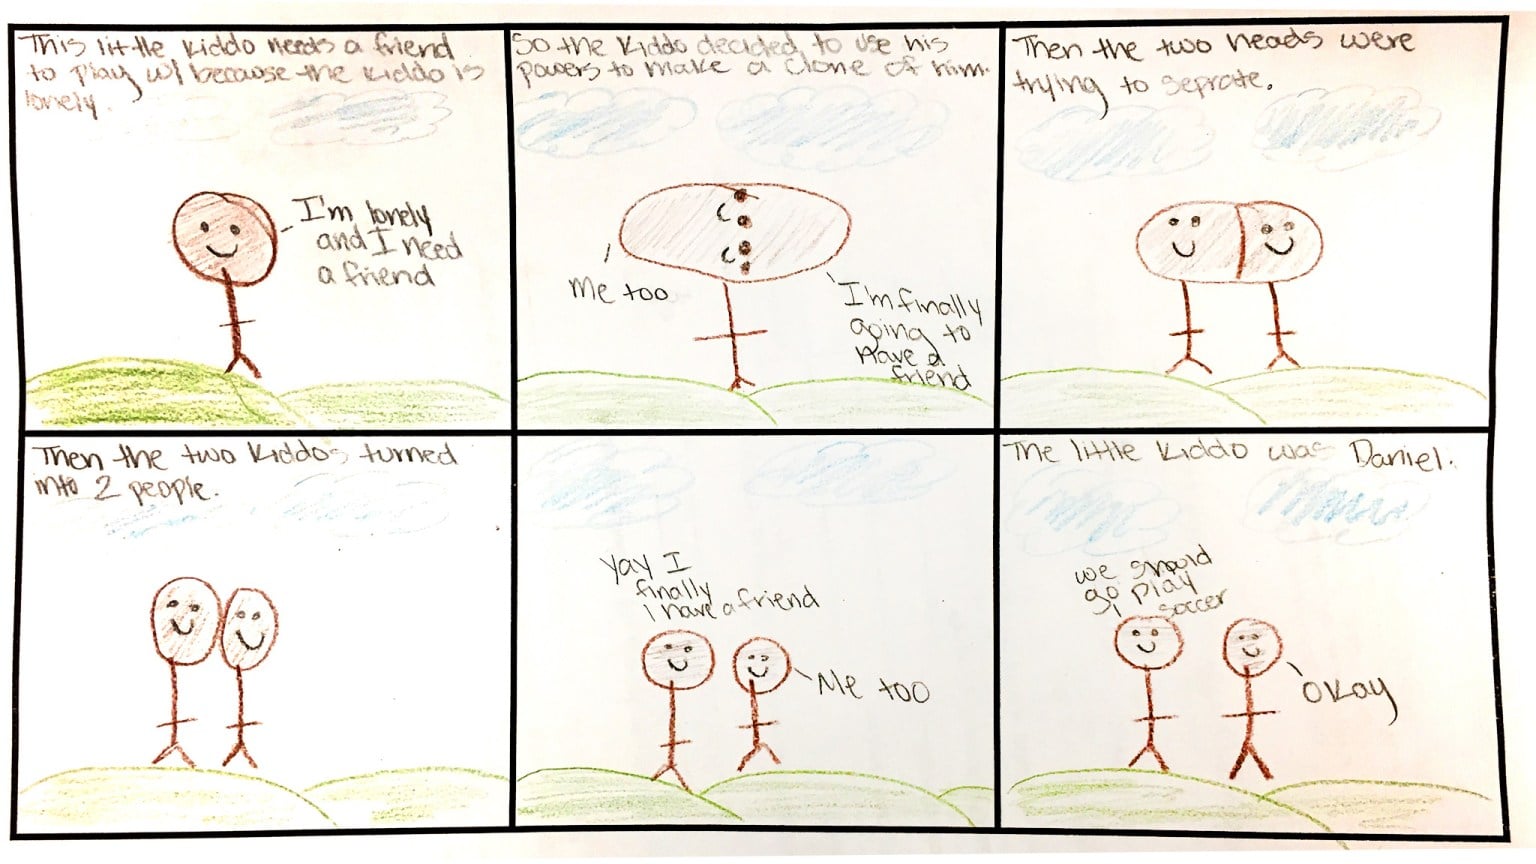
In the Cell Division Comics activity, students create short comic strips that tell the story of cell division in a creative manner. Students use abstraction to develop an analogy that still represents the scientific details they need to know about cellular division. Students brainstorm, create a quick sketch and then draw their final comic to share with their peers.
Topics addressed
- Cell division, mitosis, meiosis
- Primary CT concept: abstraction. After spending some time learning about the nitty-gritty details of cell division, this is a great opportunity for students to take a step back and think about the process at a higher level, representing each step in the process with a creative analogy.
Students will be able to
- Describe each step involved in cell division
- Create a visual representation the complete cell division process
Materials
-
Slides:


-
Student handout:


-
Comic panel templates:
- Colored pencils / markers
Suggested lesson breakdown
This project is more of a practice/synthesis tool than a teaching tool, and therefore works best towards the end of the unit.
- 5min – introduce project, go over requirements and grading rubric
- 10-15min – students brainstorm their idea and sketch a draft version of their comic strip
- 15-30min – students create the final version of their comic strip
- 5min – students share their comics with one another
Next Generation science standards
-
NGSS.HS-LS1-4
Use a model to illustrate the role of cellular division (mitosis) and differentiation in producing and maintaining complex organisms.
Common Core standards
-
CCSS.ELA-Literacy.RST.6-8.7
Integrate quantitative or technical information expressed in words in a text with a version of that information expressed visually (e.g., in a flowchart, diagram, model, graph, or table).